
Page 32 - RSB Annual Report 2019 English Final
P. 32
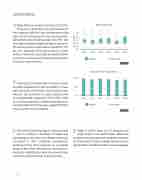
EFFICIENT COOLING Water efficiency 5.0 4.0 3.0 2.0 1.0 0.0 2014 2015 2016 Range 2017 2018 2019 Average Figure 16 Water efficiency remained constant at 7.6L/TRh. There is no improving frontier performance on this measure, that this to say the best performing plant are not making year on year improvements, with performance hovering around 6L/TRh. We have started collecting additional data to determine the volume of water evaporated in operations. Our aim is to ascertain if this performance is at the frontier of what can reasonably be expected from current DC technology, or if there are opportunities for further improvements. 100% 50% 0% Recycled water dependence Total supply of recycled water remained constant at 5,000 megalitres but with the addition of new plant yet to be connected to the recycled water network, the proportion of water demand met by recycled water dropped by 2% to 24%. Only one company reported increased dependence on recycled water during the year, suggesting there may be a limit on its availability. We monitor the percentage of customers that pay for cooling on the basis of meters and the average consumption of metered customers compared to their unmetered counterparts. Evidence shows that customers on a metered supply make lower demands for cooling but it should be noted that our data only covers those customers served directly by DC providers. 2014 2015 2016 Range 2017 2018 2019 Average Figure 17 32 RSB Sales of chilled water by DC providers are predominantly on a metered basis. Measuring supplies is important because it enables companies and customers to better manage demand and to quickly detect and effect repairs to pipe breakages. Litres per kWhc
