
Page 26 - RSB Annual Report 2020 English
P. 26
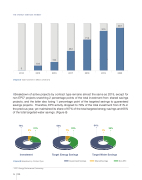
THE ENERGY SERVICES MARKET 194 108 5 2014 2015 2016 › Figure (7) Total Investment in Millions of Dirhams 2017 2018 2019 2020 712 452 987 915 ⁞ Breakdown of active projects by contract type remains almost the same as 2019, except for non-EPC2 projects snatching 2 percentage points of the total investment from shared savings projects, and the latter also losing 1 percentage point of the targeted savings to guaranteed savings projects. Therefore, EPC activity dropped to 79% of the total investment from 81% in the previous year, yet maintained its share of 67% of the total targeted energy savings and 65% of the total targeted water savings. (Figure 8) 74% 21% 60% 33% 64% 5% 7% 1% 35% Investment Target Energy Savings Target Water Savings › Figure (8) Breakdown by Contract Type 2 EPC: Energy Performance Contracting Guaranteed Savings Shared Savings Non-EPC 26 RSB
